Viewing server logs for a trace only works with the Cloud SaaS and fully self-hosted deployment options.
Access server logs from trace view
In the trace view, use the See Logs button in the top right corner, next to the Run in Studio button.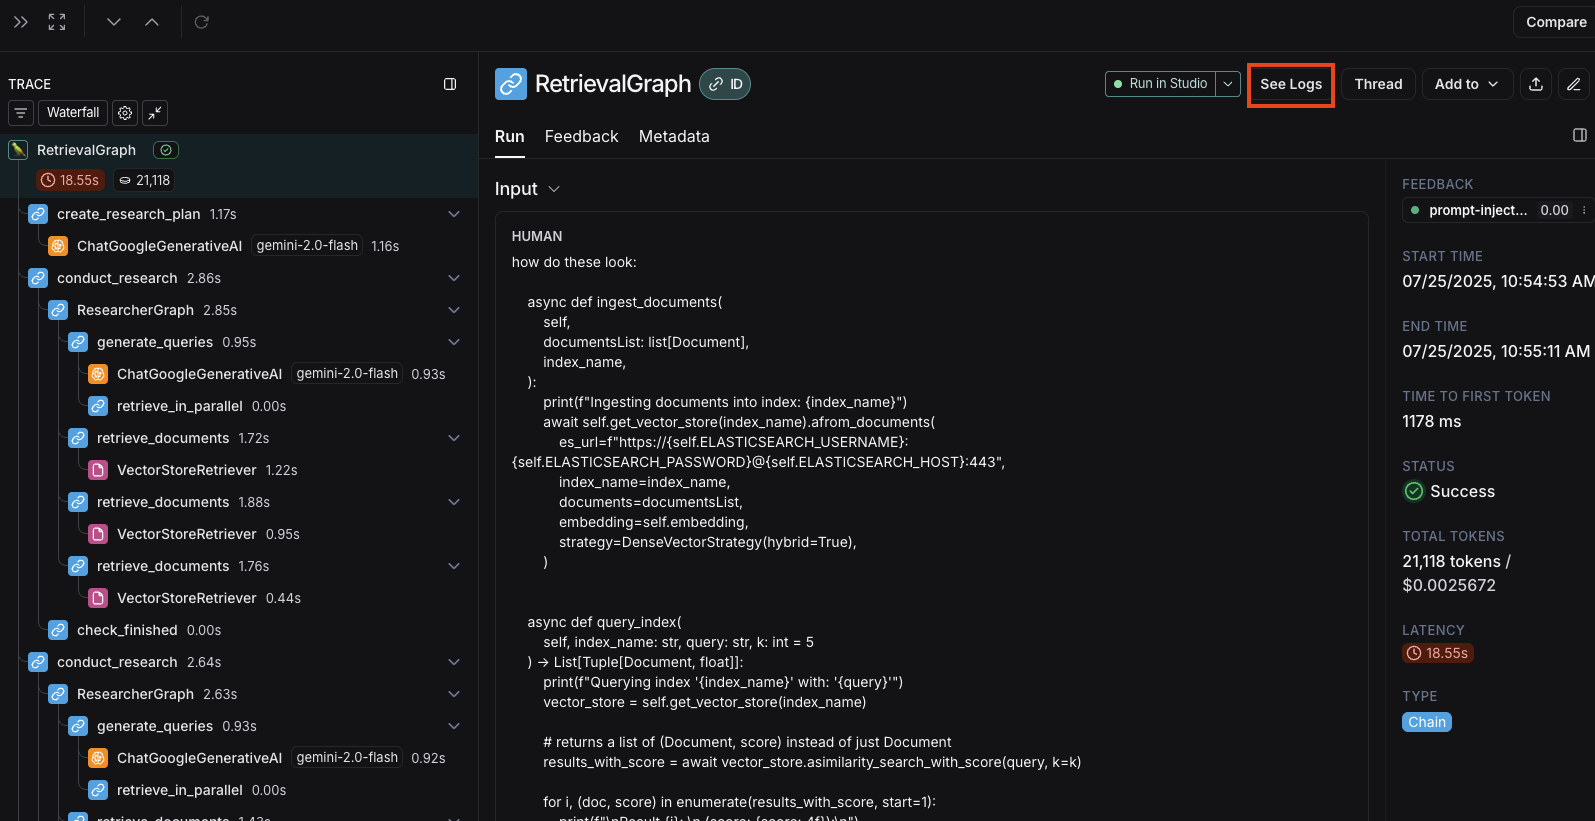
Server logs view
The server logs view displays logs from both:- LangGraph Server’s own operational logs - Internal server operations, API calls, and system events
- User application logs - Logs written in your graph with:
- Python: Use the
loggingorstructloglibraries - JavaScript: Use the re-exported Winston logger from
@langchain/langgraph-sdk/logging:
- Python: Use the
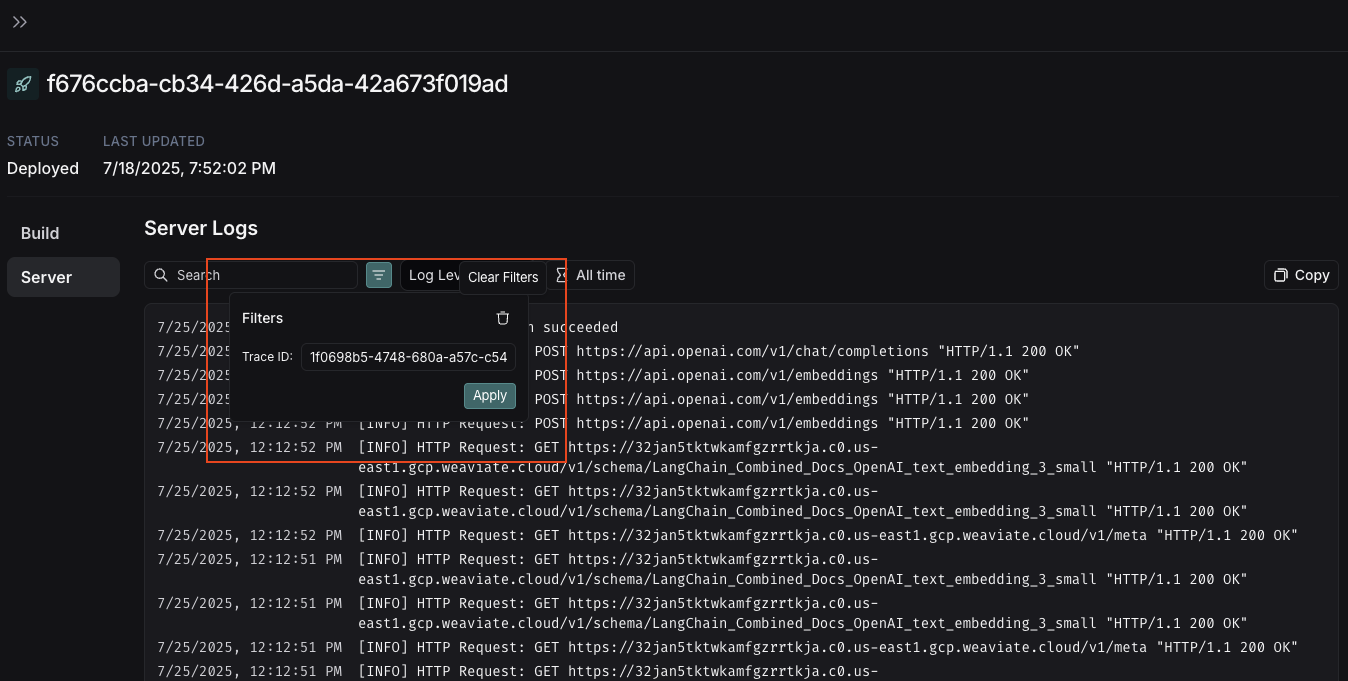
Filtering logs by trace ID
When you navigate from the trace view, the Filters box will automatically pre-fill with the Trace ID from the trace you just viewed. This allows you to quickly filter the logs to see only those related to your specific trace execution.