This section is only applicable for Kubernetes deployments.
Section 1: Prometheus Exporters
Use this section if you would like to only deploy metrics exporters for the components in your self hosted deployment, which you can then scrape using your telemetry. If you would like a full observability stack deployed for you, go to the End-to-End Deployment Section. The helm chart provides a set of Prometheus exporters to expose metrics from Redis, Postgres, Nginx, and Kube state metrics.- Create a local file called
langsmith_obs_config.yaml - Copy over the values from this file into
langsmith_obs_config.yaml, making sure to modify the values to match your LangSmith deployment. - Find the latest version of the chart by running
helm search repo langchain/langsmith-observability --versions. - Grab the latest version number, and run
helm install langsmith-observability langchain/langsmith-observability --values langsmith_obs_config.yaml --version <version> -n <namespace> --wait --debug
- Postgres:
langsmith-observability-postgres-exporter:9187/metrics - Redis:
langsmith-observability-redis-exporter:9121/metrics - Nginx:
langsmith-observability-nginx-exporter:9113/metrics - KubeStateMetrics:
langsmith-observability-kube-state-metrics:8080/metrics
kubectl get pods -n langsmith-observability, you should see:
Section 2: Full Observability Stack
This is not a production observability stack. Use this to gain quick insight into logs, metrics and traces for your deployment. This is only made to handle a few dozen GB of data per day.
Prerequisites
1. Compute Resources
The resource requests and limits for each part of the stack can be modified in the helm chart. Here are the current allocations (request/limit):- Loki:
2vCPU/3vCPU + 2Gi/4Gi - Mimir:
1vCPU/2vCPU + 2Gi/4Gi - Tempo:
1vCPU/2vCPU + 4Gi/6Gi
2. Cert-Manager
The helm chart uses the OpenTelemetry Operator to provision collectors. The operator require that you have cert-manager installed in your Kubernetes cluster. If you do not have it installed, you can run the following commands:3. OpenTelemetry Operator
Use the following to install the OpenTelemetry Operator:Installation
The following instructions will bring up OTel collectors, the LGTM stack, Grafana and Prometheus exporters.- Create a local file called
langsmith_obs_config.yaml - Copy over the values from this file into
langsmith_obs_config.yaml, making sure to modify the values to match your LangSmith deployment. - Find the latest version of the chart by running
helm search repo langchain/langsmith-observability --versions. - Grab the latest version number, and run
helm install langsmith-observability langchain/langsmith-observability --values langsmith_obs_config.yaml --version <version> -n <namespace> --wait --debug
You can selectively collect logs, metrics or traces by modifying the boolean values under
otelCollector in your config file. You can also selectively bring up each respective piece of the backend (Loki, Mimir, Tempo).kubectl get pods -n langsmith-observability, you should see:
Post-Installation
Enable Logs and Traces in LangSmith
Once you have installed the observability helm chart, you need to set the following values in your LangSmith helm configuration file to enable collection of logs and traces.- To get
${LANGSMITH_OTEL_CRD_NAME}, you can runkubectl get opentelemetrycollectors -n ${LANGSMITH_OBS_NAMESPACE}and select the name of the one with MODE =sidecar - To get
${GATEWAY_COLLECTOR_SERVICE_NAME}name, runkubectl get services -n ${LANGSMITH_OBS_NAMESPACE}and select the one with Ports 4317/4318 AND a ClusterIP set. It should be something likelangsmith-observability-collector-gateway-collector
helm upgrade langsmith langchain/langsmith --values langsmith_config.yaml -n <langsmith-namespace> --wait --debug
Once upgraded, if you run kubectl get pods -n <langsmith-namespace> you should see the following (note the 2/2 for sidecar collectors):
Grafana Usage
Once everything is installed, do the following: to get your Grafana password:langsmith-observability-grafana container at port 3000, and open your browser as localhost:3000. Use the username admin and the password from the secret above to log into Grafana.
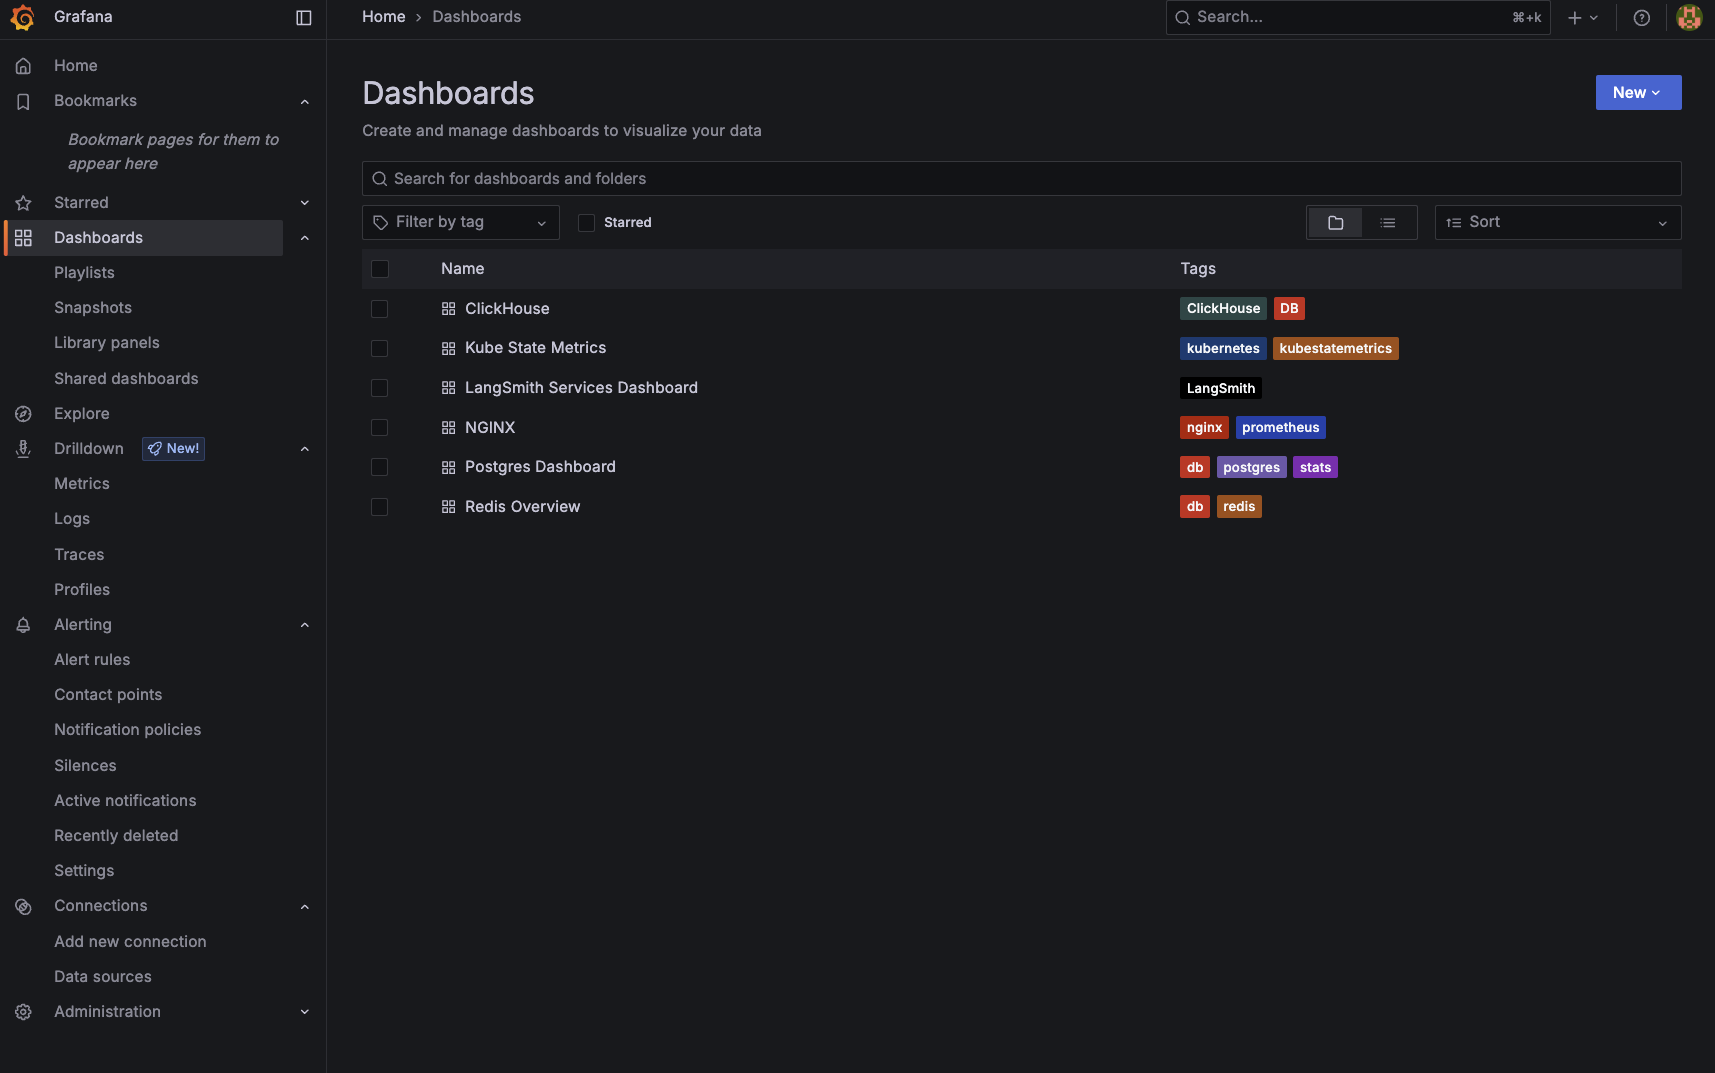
Once in Grafana, you can use the UI to monitor logs, metrics and traces. Grafana also comes pre-packaged with sets of dashboards for monitoring the main components of your deployment.